Spectroscopy in the Laboratory
Astronomical Laboratory 29:137, Spring 2018
by Philip Kaaret and Steven Spangler
Reading
Introduction
Spectroscopy is crucial to astronomy. It is the principal
diagnostic for determining the temperature and chemical
composition of stars, nebulae, and galaxies. Spectroscopy is
of equal importance to physics. No experimental evidence was
of more importance to the emergence of modern physics than the
existence of spectral lines of different atoms and
molecules. Today, spectroscopy continues to be one of the
most important experimental or observational measurement in both
astronomy and physics.
In this class, we will have the pleasure of measuring and
analyzing spectra. We will use a ST-402XME camera as the detector
of our spectrograph. The equipment which actually makes up
the spectrograph (slit, internal optics, and most importantly,
diffraction grating) is provided by a unit which connects to the
front of the ST-402XME. The instrument is called the Deep
Space Spectrograph DSS-7. This unit is also
manufactured by the Santa Barbara Instrumentation Group
(SBIG). The SBIG company designed this spectrograph to be
mounted on a telescope.
Today, we will set up the DSS-7 with the ST-402 in the laboratory
and get it working. We will then calibrate it by taking
spectra of gas discharges of hydrogen, helium, etc.
This exercise will be much more meaningful if you know what is
going on. Be sure to read sections 6.1-6.5 in Handbook
of CCD Astronomy before coming to class. Also, the
manual for the DSS-7 spectrograph has much worthwhile tutorial
material as well as indispensible material on the construction and
operation of the DSS-7. You should particularly look at Figures 1,
5, and 7 of the DSS-7 manual. An important characteristic of the
DSS-7 is its wavelength range. As stated in the manual, it
is nominally 400-800 nanometers (or 4000-8000 Angstroms, in a unit
more traditionally used in astronomy).
Equipment
- SBIG ST-402XME camera, with power adapter and USB cable
- Computer running the CCDOps software package and DS9 for image
analysis
- DSS-7 Deep Space Spectrograph
- 7 inch phone cable to connect the spectrograph and camera
- Adapter ring to connect the DSS-7 and ST-402XME
- Set of Allen wrenches, including little ones
- Gas discharge tubes of hydrogen and helium (other elements
would be good, too) plus associated power supplies.
SBIG Camera
You will use an ST-402ME or ST-402XME camera made by the Santa
Barbara Instrumentation Group (SBIG) for this lab. One of the
links above under "Reading" leads to the a description of the camera
on the SBIG web site. The software we will use to control the camera
and download data from the processor in the camera is called
CCDOps. This software package is running on the computers in
Room 655 Van Allen Hall. Download and look over the CCDOps
manual; you will need it to control and analyze data from the
camera. Before we attach the spectrometer, let's try out the camera.
- Connect the camera to the computer, and establish
communication between them. Connect power to the camera,
and run the USB cable from the camera to one of the USB ports of
the computer. Bring up CCDOps on the computer.
- You now need to have the computer and the camera talk to each
other. You do this by clicking on the "EstLnk"
button in the CCDOps Toolbar, or in the main CCDOps window, you
can select the "Camera" menu and then click on "Establish COM
link". The camera should make a number of clicking sounds
and flash its red LED while setting up the link. The red
LED should then stay solidly on to show the camera's contentment
if the link is successful.
- We'll now pretend to take an image. On the icon toolbar, click
``GRAB'', which controls taking an image. The GRAB
function is described in the CCDOps manual. Set the
exposure time to several seconds, dark frame to none, image size
to full, exposure delay to 0, special processing to none,
binning to 1, and then click ``OK''. This will open the
shutter. While the shutter is open you can see the CCD
chip.
System Setup
- Physically connect the spectrograph to the camera, as
described in step 2 in the section "Attaching the DSS-7 to the
camera" in the DSS-7 manual. There is an adapter ring, properly
threaded, which connects the DSS-7 and the ST-402XME. Figure 12
of the manual shows what the properly assembled system should
look like.
- Remove the side panel of the spectrograph with the Allen
wrench. Looking inside will give you a very clear idea of
how the spectrograph works. Be sure and compare what you
see with Figures 1, 5, and 7.
- Connect the phone line between the two units so the ST-402XME
can talk to the DSS-7. Turn on the DSS-7 with its on-off
switch. The red light in the switch should glow
(dimly). If it doesn't change the 9V battery in the
DSS-7. Connect the USB cable from the ST-402XME to the
workstation, and connect power to the ST-402XME. Bring up
CCDOps, connect to the camera, and listen for the contented
clicking sounds.
- Now we wil check that the mechanisms inside the DSS-7 move
correctly. Start by disabling the DSS, in CCDOps do
DSS/DSS Mode and make sure that the "Enable DSS" box is not
checked. Now run through the commands that move the slit
in and out of the light path and rotate the diffraction
grating. This procedure is done as described in the
section "Aligning the DSS-7 to the camera:" of the DSS-7 manual,
starting on page 11. One will use the Track/Move Telescope
and then run through the movements.
- When you have checked that all of the mechanisms move
properly, close the side panel on the DSS-7.
Centering and Focusing on the Slit
The goal is to make sure that the internal optics of the
spectrograph are focused on the slit and that the slit images are
falling in the middle of the CCD chip (instead of off to the
side).
- Begin by picking DSS in the CCDOPS menu, and now checking the
ENABLE DSS box. This means the spectroscopic
commands to the computer will move the slit and diffraction
grating. The following commands are also in the DSS-7
manual in the section "Aligning the DSS-7...".
- Choose VIEW SLIT from the DSS menu, and choose an exposure
time of 1 second. This runs the camera and spectrograph in
normal camera mode, except you are taking a picture of the
slit. You should see an image of the slit (see Figure 2 in
the manual), which is blurry (out of focus), offset from the
center, and rotated with respect to the horizontal. We
need to correct all three of these. The slit actually consists
of 5 slits of different widths. The larger the width of
the slit, the poorer the spectral resolution, but the higher the
signal-to-noise ratio because more light is admitted. This
instrument lets you confront the trade-off, always present in
astronomical spectroscopy, between high spectral resolution and
high signal-to-noise ratio. For the experiment in the lab,
we will use the narrowest slit with the highest spectral
resolution.
- If necessary, focus the internal optics on the slit. Be
sure and read the section in the manual entitled "Aligning the
DSS-7 to the camera" for guidance on how to do this. Look
at Figure 13 in the manual for an idea of what we have to
do. On the side of the spectrometer opposite of the side
panel that you just removed and replace, there is a pair of
screws with Allen heads. Loosen the two screws on the
little plate. Do not touch the other two screws.
Once you have loosened them, move the little plate back and
forth. This moves one of the focusing lenses in the
instrument. Run the camera in focus mode. Continue
adjusting the position of the sliding plate until the images of
the slits are as small as possible, and the edges are
crisp. Then re-tighten the screws on the slider.
Tightening the screws often shifts the focus, which can make
getting a really focus a bit frustrating.
- Finally, put the narrowest slit in the middle of the CCD chip,
and align it so it is parallel to the vertical direction as seen
on the workstation screen (i.e., the way a spectrograph slit
should be). The spectrograph can be moved relative to the
camera by loosening the brass thumbscrews and moving the
spectrograph around. You will need to both rotate
and translate the spectrograph. In the end, the image on
the workstation screen should look like Figure 2 (copied below)
in the manual with the narrowest slit centered and vertical in
the image.

Let's take a moment to discuss the spectrum images. The image
of the spectrum of a hydrogen lamp is shown below. The
horizontal axis in the image below is the 'dispersion axis', i.e.
the axis along which the photons are dispersed by the grating
according to their wavelength. Thus, position along the
horizontal axis is a measure of wavelength (which we will calibrate
in detail below).
The vertical axis is un-dispersed. The grating essentially
acts like a mirror for reflection in this axis. Thus, the
vertical axis is actually a spatial axis. A vertical slice
across the spectral image through a bright spectral line will give a
one-dimensional image of the source along an axis aligned with the
slit. For the hydrogen lamp, the light source fills the whole
slit, so one sees the whole outline of the slit in the bright
lines. In contrast, a star will fill only a few pixels of the
vertical extent of the slit.

Sometimes spectra images are binned along the vertical
direction. Typically one integrates a stellar spectrum across
the whole width of the stellar image, usually several pixels.
When acquiring spectra, CCDOps has an option to do this binning for
you. Setting 'Vertical Binning' to a value greater than one,
simply combines that number of adjacent vertical pixels. To
set the vertical binning for dark frames, do Camera/Setup and look
at the 'CCD Setup' part of the dialog box. It should be fine
to set 'Vertical Binning' to a small whole number to combine
vertical sets of pixels and allow shorter exposures times.
However, it seems that CCDOps ignores 'Vertical Binning' when taking
dark frames, so keep 'Vertical Binning' set to 1. It is
important to have a set of dark frames that can be directly
subtracted from the spectrum images; the dark frames should have the
same vertical binning and exposure time.
- To acquire a spectrum, do DSS/DSS Mode then check the boxes
for 'Grab Spectra' and 'Enable DSS', set 'Vertical Binning' to
1, adjust the exposure time, and then click 'OK'.
- The 'Grab Spectra' command does not do dark frames, so you'll
need dark frames for all the exposure times that you use for
your final set of spectra. Note that the exposures needed
for the spectra can be long, so you might want to cool the
CCD. Be sure that your spectra and darks are taken at the
same temperature and with the same vertical binning.
We are now ready to take data.
Data Taking and Measurements
The main goal of this lab exercise is to calibrate the
spectrograph. You will now take spectra of hydrogen, helium,
and neon lamps and blue and red LEDs for calibration
purposes. We will need to have the lights off in the lab for
this part.
- The "Spectrum Tube Carousel" has several different gas
discharge tubes. Make sure the power supply is off while
rotating the carousel.
- Select the Hydrogen tube in the carousel and turn it on.
Don a pair of diffraction grating glasses and admire the
spectrum of lines produced by hydrogen. Remove the
glasses.
- Set up a white piece of paper (that we'll call the screen) and
adjust the tube carousel so that the Helium tube illuminates the
screen. Adjust the DDS-7 so that it views the light from
the tube on the screen. The point of the screen is to
spread the light from the tube roughly uniformly over a larger
area than just the tube itself. This helps in obtaining a
spectrum that is uniform over the whole length of the
slit. One can get the same result using paper as a
diffuser, with light passing through it, rather than as a
screen.
- Acquire a spectrum (DSS/DSS Mode/Grab Spectrum or Grab).
Adjust the exposure time so that the brightest pixels in the
image of the narrowest slit are have values of at least several
1000 counts but are not saturated. Save the spectrum with
a filename containing 'helium'. You should also get into
the habit of specifying the object (in this case 'helium lamp')
while saving so that it is written to the FITS header.
- Repeat the this procedure for the hydrogen tube and the neon
tube. You might need to adjust the position of the
carousel, screen, and DSS-7 for each lamp. Save the
hydrogen and neon spectra.
- Now replace the tube carousel with one of the LED boxes.
To turn on the LED box, press the button on top.
Repeatedly pressing the button cycles through the various LEDs
with two brightness settings for each. Set the box so the
red LED is on at the brighter level. Position the LED box
so that it illuminates the screen and the DSS-7 so that it views
the illuminated portion of the screen. Acquire and save a
spectrum of the red LED.
- Repeat this procedure for the blue LED and acquire and save a
spectrum of the red LED.
- Check that you have a full set of spectra (helium, hydrogen,
neon, red LED, blue LED) and that the brightest pixels in the
image of the narrow slit for each spectrum has a decent signal
but are not saturated. Go back and re-acquire any spectra
that are bad or dodgy. Now take and save dark frames for
every exposure time that you used for your set of final
spectra. Be sure that each dark is at the same temperature
as the corresponding spectrum.
- When you are finished, shut down the system. Turn off
the DSS-7 and shut down the ST-402.
Gratings
When light is normally incident on a grating, the diffracted
light will have maxima at angles θm given by:
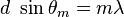
where d is the spacing of the rulings on the grating, m
is the order number and can be any integer, λ is the wavelength of
the light. This is the so-called 'grating equation'.
From inspection of Figure 1 in the DSS-7 manual (or inspection of
the DSS-7 itself with the panel removed), one can see that the
DSS-7 is designed so that the light is normally incident on the
grating (when used in spectroscopic mode). The DSS-7 grating
operates in first order when used in spectroscopic mode.
Thus m = 1.
Calibrating the Spectrograph
In principle, one could measure the d and then trace the
path of rays through the DSS-7 and ST-402 to find the angle θ
corresponding to each pixel in an image. In practice,
this is too difficult and fraught with error, so one, instead,
observes a light source, usually a gas discharge lamp, that
produces several emission lines of known wavelength and uses those
to determine the relationship between pixel number and wavelength
of spectral lines for the spectrograph. This is called
'calibrating the spectrograph'.
To do this, one must first identify the various lines in each
spectrum.
- Load the spectra for hydrogen, the red LED, and the blue LED
into ds9. You will want to look at all three spectra
simultaneously, so after you load the first spectrum, do
Frame/New Frame before loading each of the other spectra.
Then after all three spectra are loaded, do Frame/Tile Frames
and Frame/Frame Parameters/Tile/Rows. You should see your
three spectra in three rows.
- You may want to play with the scale settings for each image in
ds9 in order to get the lines (more like bands for the LEDs)
visible. People often look at spectra using an inverted
colormap (Color/Invert Colormap) when examining spectra (it
saves on toner when printing).
- After you are done adjusting your images, do
Frame/Match/Frame/Image to make sure that all of the images are
lined up in ds9. This allows you to directly compare pixel
number between the images.
- Print out the three images (together) and paste into your
notebook. Mark which image is which in your notebook.
- The dominant lines in the hydrogen spectrum should be H-alpha
at 656.285 nm and H-beta at 486.133 nm (see Appendix A of
the DSS-7 manual). Figure out which is which by comparing
with the blue and red LED spectra. Write down the image x
coordinate of the center (vertically and horizontally) of the
H-alpha and H-beta lines. These are your first
approximation to the calibration of the spectrograph.
Estimate the width of the line (in terms of number of pixels).
- Write down the image y coordinates of the center of the lines
for use later. These should be the same or very close to
the same. Determine the width of the line image in y.
You will now calibrate your spectrograph using Python and your
hydrogen spectrum with its newly identified lines.
In general, there can be a complex relation between pixel number
p and diffraction angle θ that depends on the
optical properties of the spectrograph. If the diffraction
angles are small, θ << 1, then the relation between
pixel number p and diffraction angle θ can be
approximated as p = aθ + b.
We will use a linear relationship. Note that since there are
only two strong lines in the hydrogen spectrum, we don't actually
have enough information to derive a more complex calibration
curve. In astronomical research, much larger line sets,
often 20 to 40 lines or more, are used to correct for
non-linearities in the pixel number versus wavelength
relation. The software that comes with the DSS-7 also only
uses two lines and the manual states that the calibration is good
to 0.1 pixels.
- Load hydrogen.py into your
preferred text editor. Edit the lines that read in the
spectrum files to match the names of your files. Edit the
variable y0 to match the value that you found using ds9 for the
(vertical) line center and the variable dy to be half of the
width of the line (or a bit smaller). Note that the code
assumes that wavelength increases with x. If your
spectra are flipped so wavelength decreases with x, you should
change the call to range on line 109 to k = range(k0, k1,
-1).
- Run the program. You should see a 2d image of the
spectrum, similar to what you saw in ds9 (you many want to edit
the values for vmin and vmax in the plt.imshow command if the
lines don't show up well) and a line plot of a 1d
spectrum. Adjust y0, dy, vmin, and vmax until you are
happy with the plots.
- Now edit the values in the arrays linec and lined to match the
line centroids and half the line widths that you estimated from
ds9. Note that these values must be integers. Make
sure that the centroids correspond to the right wavelength in
the array linew.
- Run the program again. Inspect the vertical lines
overdrawn on the 1d spectrum plot. Each pair of dashed
lines marks the interval used to calculate the centroid of a
spectral line. The solid line between them marks that
centroid. Check your intervals and centroids and adjust
them so they look reasonable. The ipython plot windows are
interactive, so you can zoom in on your lines. Click on
the cross with arrows, then left click in the plot window to pan
and right click to zoom. Clicking on the house will
restore the plot to its original settings.
- When everything is good, run the program again print out the
1d spectrum (versus pixel number) plot and put it in your lab
notebook.
- After calculating the centroids, the program does a linear fit
to the pixel versus wavelength relation (which is trivial when
only using two points). Rather than using just two
parameters as needed to specify a line, the program prints out
three parameters which are the average pixel number of the lines
used in the calibration, the corresponding wavelength, and the
slope of the relation. Record these.
- The last part of the program applies the calibration, makes a
spectrum plot versus wavelength, and calculates centroids in
terms of wavelength given a line list in terms of
wavelength. Inspect that plot. Adjust the values of
lined in the 'Line centroids in wavelength' part. Print
out the plot when you are satisfied. Note that with only
two points for the calibration, the calculated wavelengths
should match the known values exactly. Once you have a
calibration, specifying lines of interest in terms of wavelength
is much more convenient since the wavelengths are known before
hand.
Having now calibrated our spectrograph, we can test the accuracy
of the calibration.
- Save a copy of hydrogen.py as spectra.py. Delete the
stuff about plotting the spectrum versus pixel number and
finding line centroids in pixels (since we will now be working
in wavelength). You can also delete the stuff about
plotting the difference image if you like (or leave if it you
like to double check you have the right spectrum image).
Replace the lines where the calibration is calculated with
statements that assign your calculated values to centralp,
centralw, and slope.
- Run the program and checks that it work on the hydrogen
spectrum and finds the appropriate centroids.
- Now look at the helium spectrum. Edit the file name (and
dark file if needed) to load the helium spectrum. Find at
least five lines. You might want to change to a log scale
on the vertical axis to see weak lines. It is good to peak
narrow lines, since the broad features are often combinations of
multiple lines and it is harder to accurately calculate the
centroid of a broad line.
- You can get an estimate of the wavelength of by moving your
cursor over it and the x position at the bottom, right of the
plot window. Find your lines in the Tables at
http://physics.nist.gov/PhysRefData/Handbook/Tables/heliumtable2.htm
If there are multiple lines close to your estimated wavelength,
pick the one with the highest intensity in the table. Edit
the values for linew and lined.
- Note that you really need to inspect each line. The
centroiding code will always find a centroid, even if there is
no line present. Indeed, if you draw on interval on
a region with no line, the centroid will be very close the
center of the region, so it is easy to get spurious good
agreement between input wavelengths and centroids.
- After you have found at least five lines and calculated their
centroids, print out a plot of your spectrum with all of the
centroid overplotted.
- Take your centroids and calculate the difference (centroid -
known wavelength) and then the standard deviation of those
differences. The standard deviation is a measure of the
accuracy of your calibration of the spectrograph.
Calculate it in wavelength units and also convert that number
into pixels using the slope of your calibration. Record
your calculations and thoughts in your lab notebook.
For extra credit, you can repeat this exercise for your neon
spectrum. A list line for neon is available here:
http://physics.nist.gov/PhysRefData/Handbook/Tables/neontable2.htm
(not just any line list, the official US line list). If you
are planning on using the DSS-7 for your research project, you
should think about how you can use the whole set of line spectra to
improve the calibration.