Figure 3:
Histogram of measured energy for a 5.9 keV source.
Figure 4a:
IPC response to X-ray positioning test.
Figure 4b:
IPC response after correction.
Figures/Tables
Front Page
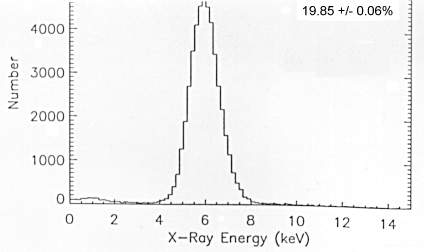 Figure 3: Histogram of measured energy for a 5.9 keV source.
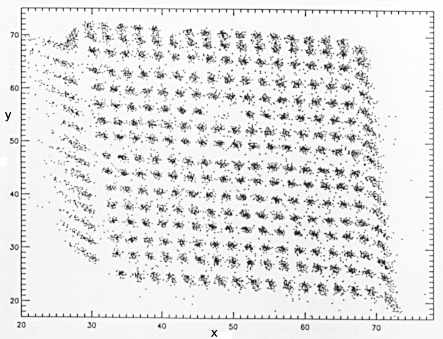 Figure 4a: IPC response to X-ray positioning test.
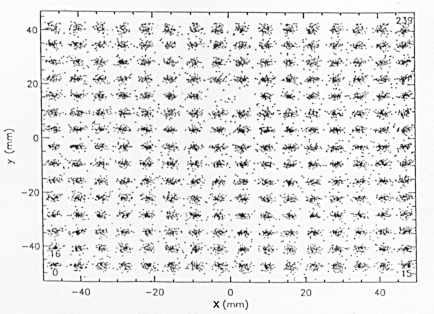 Figure 4b: IPC response after correction.