Aperture Photometry
Astronomical Laboratory ASTR:4850, Fall 2015
by Philip Kaaret
Reading
Introduction
In this lab, we will do photometry on images that you obtained
using the Van Allen Observatory. We will be looking at a
pair of images of the open star cluster M39 obtained in the
B-band. You should have one image with the cluster centered
in the telescope view of view and another image that is offset by
5 arcminutes in declination. We will also use frames that
you obtained for bias and dark current and a flat field obtained
by the magnificent Dominic Ludovici. Ten flat field images were
taken in the B-band filter and processed to produce this B-band master flat.
CCD Data Reduction
To accurately measure the flux of light from a star, we need to
correct for imperfections in the response of the CCD and also in the
response of the telescope. In the lab on "Readout Noise and
Dark Current", you already learned about pedestals, bias, and dark
current in CCDs. It is essential to subtract a bias or dark
frame from each astronomical exposure. The CCD camera on the
VAO is cooled and has very low dark current, as you should have
found in the previous lab. The images that you will be using
today were taken with short, 5-10 second, exposures. The dark
current is negligible for these short exposures, so in the equation
below it is OK to use bias or dark frames for subtraction.
One usually take several bias (or dark frames) and combines them
into a single master bias image. This 'master bias' image was made by
combining 10 bias images via median filter, i.e. the value of each
pixel is the median of the values for that pixel in the 10
images. What advantages are there to using a master bias image
over a single bias image? Explain in your lab notebook.
The quantum efficiency of CCDs can vary from pixel to pixel.
Also, every optical system suffers from variations in its response
across the field of view and localized variations due to
imperfections such as dust. To correct for these variations,
one attempts to uniformly illuminate the telescope field of view and
then takes a 'flat field' frame. This frame is then used to
correct for the response across the field of view. In
practice, one divides the value in the each pixel in astronomical
image by the value for the corresponding pixel in the flat
field. Think about this for a moment and convince yourself
that it is the correct way to apply the flat field calibration - if
one region of the camera has a higher quantum efficiency, what will
that mean about the number of counts in that region in the
astronomical image and in the flat field? Explain in your lab
notebook.
Usually, one takes several flats and then calculates the median in
each pixel. Why is use of the median preferred to use of the
mean in calculating flats? Explain in your lab notebook.
The process of correcting for instrumental imperfections is called
'data reduction'. Essentially, one is attempting to produce an
image that most accurately presents the true spatial distribution of
flux on the sky (in the selected waveband). Represented as an
equation, the
Reduced image = (Raw astronomical image - Dark
frame)/(Flat field frame)
To keep the units of the reduced image in something close to ADUs,
one usually normalizes the flat field frame before doing the
division. Typically one divides the flat field frame by its
median so that the flat field correction for pixels with near the
median response is near 1.
Write a python program to calculate reduced images and show them on
the screen. Normalize the flat field to its median before
applying the flat field correction. You may want to draw on
the various python programs that you have previously used in this
class when writing your code.
Stellar Magnitudes
We should review what we learned about stellar magnitudes in
General Astronomy. Let F be the flux of radiation from a
star (Watts/m2). Given fluxes F1 and
F2 from two stars, the difference in their
magnitudes is then
m1 - m2 = 2.5
log(F2 / F1)
Attributing a single number to the magnitude of a star is done by
essentially expressing its magnitude difference relative to Vega,
which by convention has an apparent magnitude of 0. In analyzing
CCD data, we use the fact that the number of CCD counts (total
charge, corrected for dark current and flat fielding) due to a
star is proportional to the flux F. This about that last
sentence for a while, if it is not clear to you, discuss within
your team and with the instructor.
Finding Magnitudes
Astronomers usually measure magnitudes relative to one or more
reference stars. A great thing about the sky is that it contains
many stars. Thus, even when pointing at a arbitrary field on the
sky, there is often a cataloged star with known magnitude in the
field. If there are no cataloged stars in an image, then one needs
to take a calibration image with the same telescope under similar
observing (sky brightness, seeing, etc.) and instrumental
(exposure time, CCD temperature).
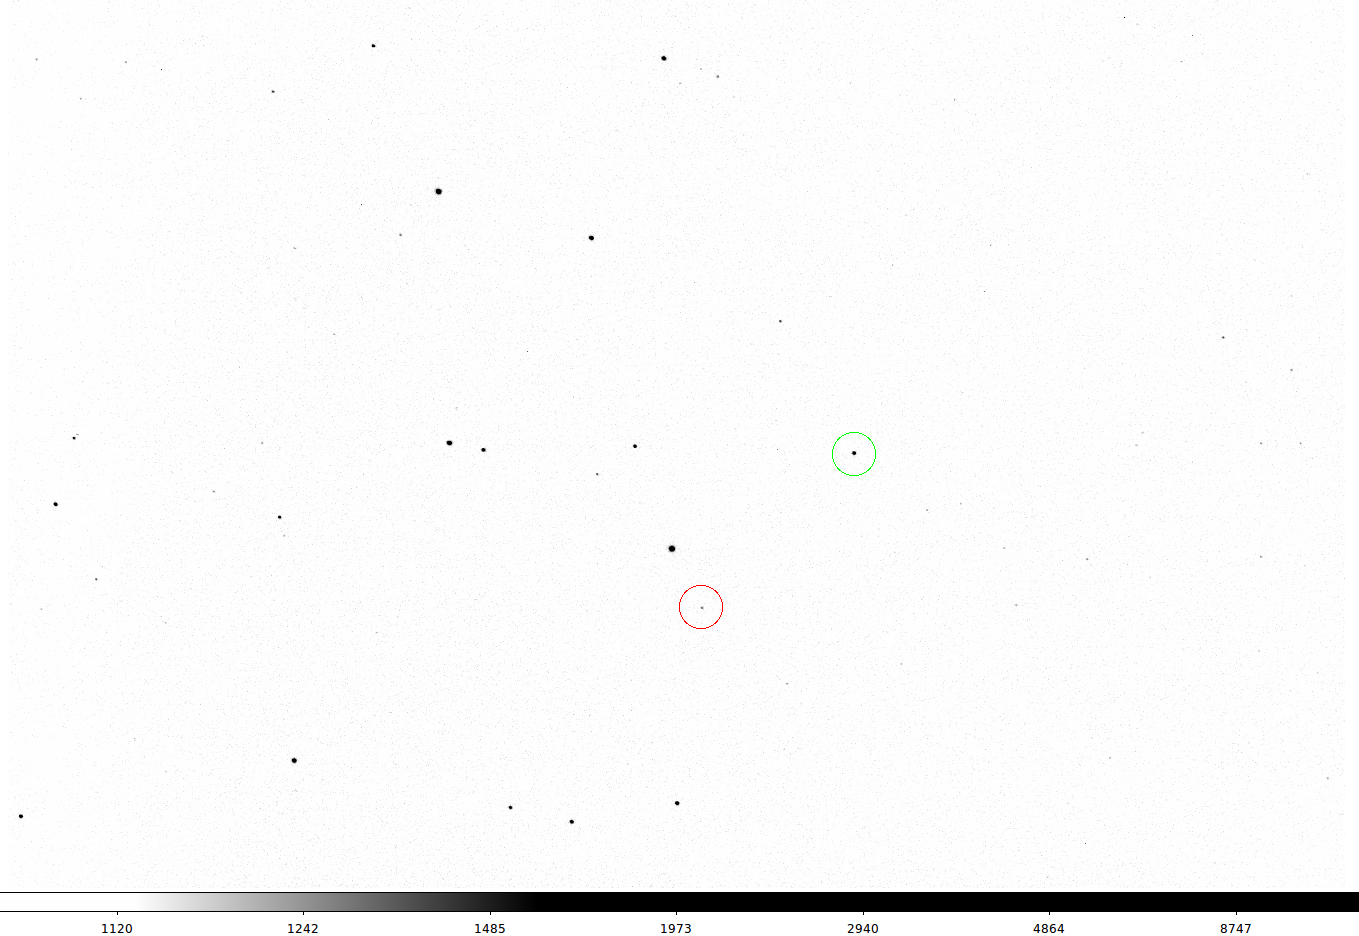
The images for this lab are of M39 and contain a number of bright
stars. The brightest star, located near the center of the
field of view, is HD 205210 and is saturated, so not suitable for
calibration. Instead, we will use BD +47 3462, located in
the green circle in the image below, as the calibration
star. It has a B-magnitude of 9.12 and V-magnitude of 9.02.
The star of interest for this lab is the one inside the red
circle on the image below. Load the two astronomical images
into ds9 and find the coordinates each of these two stars in each
of the two images. Note that you want to find the
coordinates in physical units for use in your python programs
below.
Now we will do aperture photometry, as we did in the "Signal versus
noise" lab. However, you will do the photometry in python
rather than ds9 (or MaximDL).
We will do a few steps to first understand extraction of counts and
the signal to noise ratio, so do these first steps on a bias
subtracted image, but do not do the flat field correction.
First, we need to find the coordinates of the star. Write a
python function that is given a pair of coordinates (x,y)
and a box size (s) and finds the centroid of the source
located inside the box using the equations in section 5.1.1 of the
textbook. The centroid should be returned as two floating
point variables.
Now, you need to calculate the net number of counts for the
calibration star and the target star, after doing a sky background
subtraction. The key steps are:
- Calculate the number of ADU counts in a circular region
centered on the source. The circle should be large enough
to capture most of the counts from the star, but not so large
that it includes extraneous sky background.
- Calculate the number of ADU counts in an annular region
centered on the source. The inner radius should be larger
than the radius of the circle. The area of the annulus
should be several times the area of the circle, but not include
any other sources.
- Find the net source counts by subtracting (circle counts) -
(annulus counts)*(area of circle)/(area of annulus)
Write your python code so that the routine to calculate the net
counts for a source is a function to which you supply the image and
the parameters of the circle and the annulus. Note that you
might want to write a routine that calculates the counts in a circle
of a given radius as a first step (such a routine will also be
useful below).
To see how the number of counts depends on the extraction radius
(the radius of the circle), make a plot similar to figure 5.6 in the
textbook, specifically a plot of net counts versus radius.
Choose an inner radius for the sky background annulus that is larger
than your largest extraction radius. Do this for both the
calibration star and the target star.
Now calculate the signal to noise. Use the equation from
section 4.4 of the text book (or from the Signal to Noise
lab). We concluded above that the dark current is negligible
in these images, so ignore the dark current term. Write a
python program to make a plot of the signal to noise ratio versus
extraction radius.
Now we are finally ready to do photometry. You should do
photometry on the reduced image that you calculated above, so you
can either add steps for photometry to that program, or modify that
program to write out the image (preferably in FITS format) and write
a second program to read in the image and do the photometry.
When you have the net counts for the calibration star and the
target, you should then calculate the ratio of fluxes of the two
objects. Finally, calculate the magnitude of the target star
using the known magnitude of the calibration star. Repeat this
procedure for both images. Compare the values and estimate the
accuracy of your photometry. Include your python programs with
your write up.